1
2
3
4
5
6
7
8
9
10
11
12
13
14
15
16
17
18
19
20
21
22
23
24
25
26
27
28
29
30
31
32
33
34
35
36
37
38
39
40
41
42
43
44
45
46
47
48
49
50
51
52
53
54
55
56
57
58
59
60
61
62
63
64
65
66
67
68
69
70
71
72
73
74
75
76
77
78
79
| import numpy as np
import pandas as pd
import streamlit as st
from PIL import Image
import folium
import vworld_key
def main():
st.set_page_config(page_title='Where to meet', layout="wide")
st.sidebar.image(Image.open('streamlit_logo.png'))
st.sidebar.write("---")

rainbow = ['red', 'orange', 'yellow', 'green', 'blue', 'navy', 'purple']
color = ['black', 'black', 'black', 'white', 'white', 'white', 'white']
text = 'WELCOME'
for r, c, t in zip(rainbow, color, text):
    st.sidebar.markdown(f"<h3 style='color:{c}; background-color:{r}'>__{t}:</h3>", unsafe_allow_html=True)
st.sidebar.write("---")
st.sidebar.text("This is Jiwon!\nNice to meet you!")
st.header("A Letter From Peter")
st.subheader(':blue["Let me know where we will meet on Satuerday, with the dashboard made by streamlit."]')
st.write("---")
col1, col2 = st.columns([1,2])
with col1:
st.image(Image.open('question.jpg'))
with col2:
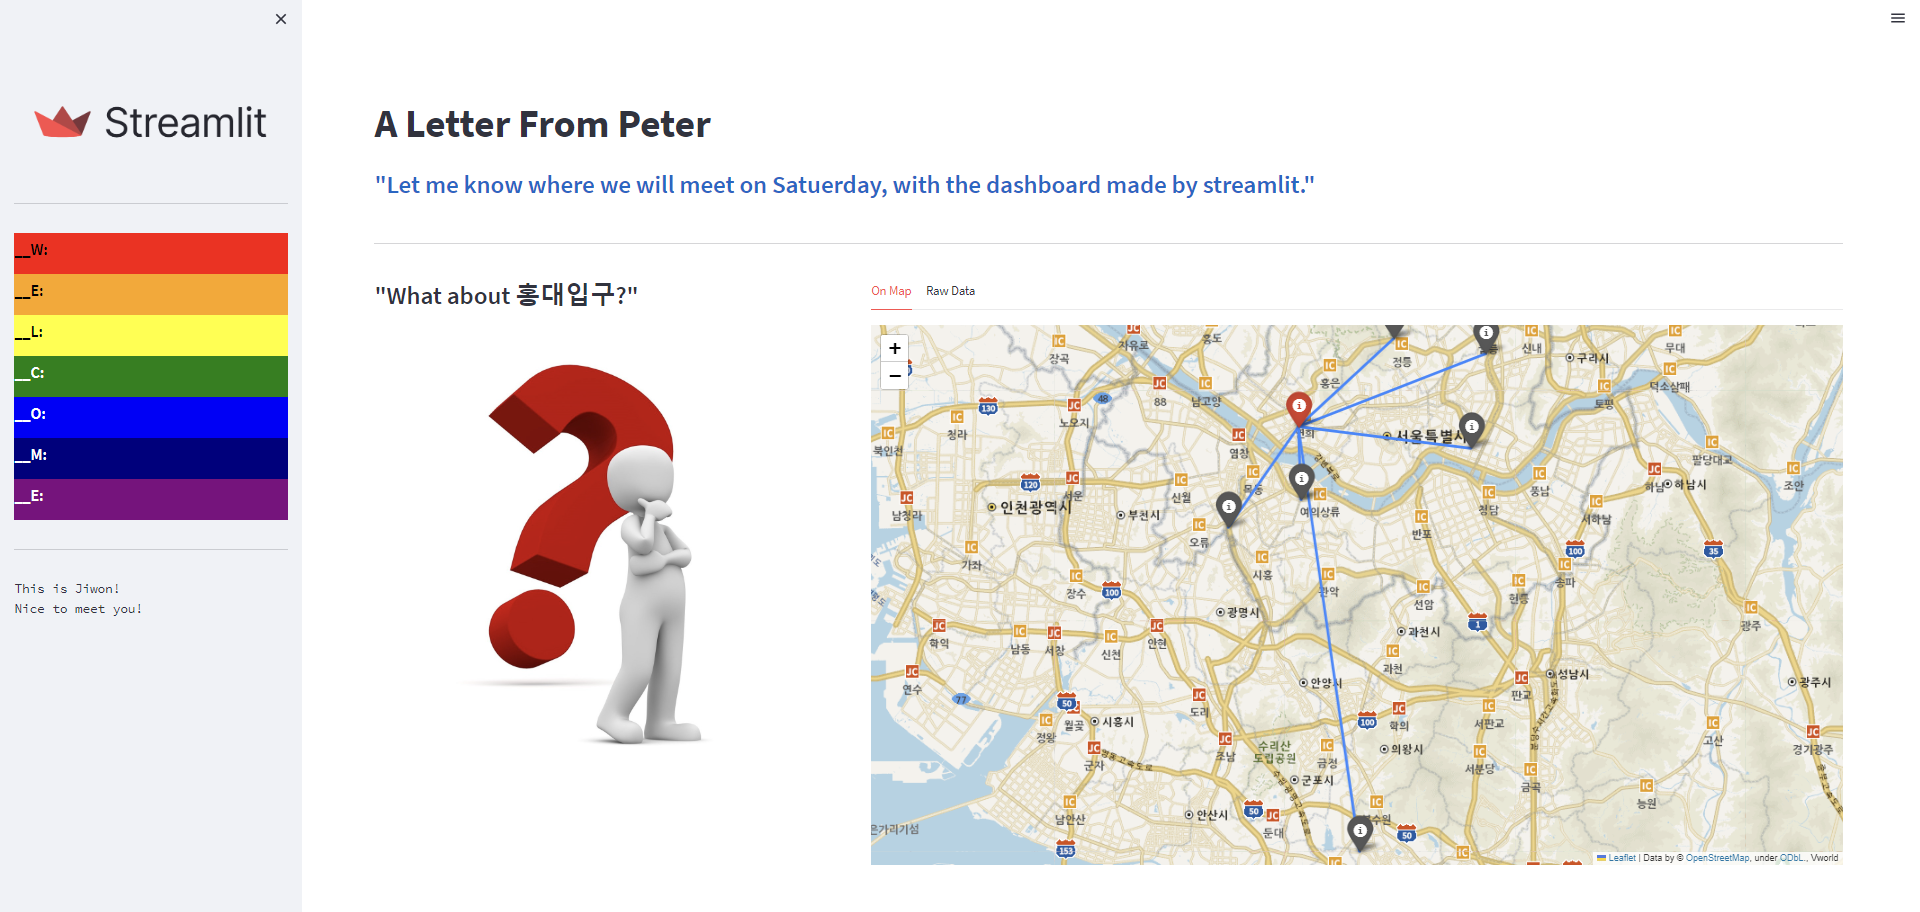
st.subheader(':blue["What about 홍대입구?"]')
center = [37.5575,126.9245]
df = pd.read_csv("place.csv", encoding='utf-8')
df['to_홍대'] = np.round(np.sqrt(np.power((df['Lat']-center[0]),2) + np.power((df['Lon']-center[1]),2)),2)
tab1, tab2 = st.tabs(['On Map', 'Raw Data'])
with tab2:
st.write(df)
with tab1:
m = folium.Map(location=center, zoom_start=11)
tiles = f"http://api.vworld.kr/req/wmts/1.0.0/{vworld_key.key}/Base/{{z}}/{{y}}/{{x}}.png"
folium.TileLayer(
    tiles=tiles,
    attr="Vworld",
    overlay=True,
    control=True
).add_to(m)
for idx, row in df.iterrows():
    folium.Marker(location = [row['Lat'],row['Lon']], tooltip=row['Name'], icon=folium.Icon(color='gray')).add_to(m)
    folium.PolyLine(locations = [center, [row['Lat'],row['Lon']]], tooltip=row['to_홍대']).add_to(m)
folium.Marker(location = center, tooltip='홍대입구역', icon=folium.Icon(color='red')).add_to(m)
m.fit_bounds(m.get_bounds())
m.save('map.html')
st.components.v1.html(open("map.html", "rb").read(), height=600)
st.write("---")
if __name__ == '__main__':
main()
|