K-means Clustering
Find mean of pixel value : cluster center, centroid
Determine the centers of k clusters at random.
Find the nearest cluster center from each sample and designate it as a sample of that cluster.
Change the center of the cluster to the average value of the samples belonging to the cluster.
Repeat 2~3 until there is no change in the center of the cluster.
Import Data 1 !wget https://bit.ly/fruits_300_data -O fruits_300.npy
--2022-03-31 02:09:21--  https://bit.ly/fruits_300_data
Resolving bit.ly (bit.ly)... 67.199.248.10, 67.199.248.11
Connecting to bit.ly (bit.ly)|67.199.248.10|:443... connected.
HTTP request sent, awaiting response... 301 Moved Permanently
Location: https://github.com/rickiepark/hg-mldl/raw/master/fruits_300.npy [following]
--2022-03-31 02:09:21--  https://github.com/rickiepark/hg-mldl/raw/master/fruits_300.npy
Resolving github.com (github.com)... 140.82.114.3
Connecting to github.com (github.com)|140.82.114.3|:443... connected.
HTTP request sent, awaiting response... 302 Found
Location: https://raw.githubusercontent.com/rickiepark/hg-mldl/master/fruits_300.npy [following]
--2022-03-31 02:09:22--  https://raw.githubusercontent.com/rickiepark/hg-mldl/master/fruits_300.npy
Resolving raw.githubusercontent.com (raw.githubusercontent.com)... 185.199.108.133, 185.199.109.133, 185.199.110.133, ...
Connecting to raw.githubusercontent.com (raw.githubusercontent.com)|185.199.108.133|:443... connected.
HTTP request sent, awaiting response... 200 OK
Length: 3000128 (2.9M) [application/octet-stream]
Saving to: ‘fruits_300.npy’

fruits_300.npy      100%[===================>]   2.86M  --.-KB/s    in 0.01s

2022-03-31 02:09:22 (223 MB/s) - ‘fruits_300.npy’ saved [3000128/3000128]
1
2
3
4
import numpy as npfruits = np.load('fruits_300.npy' ) print (fruits.shape)
(300, 100, 100)
1
2
fruits_2d = fruits.reshape(-1 , 100 *100 ) print (fruits_2d.shape)
(300, 10000)
KMeans Class 1 2 3 from sklearn.cluster import KMeanskm = KMeans(n_clusters=3 , random_state=42 ) km.fit(fruits_2d)
KMeans(n_clusters=3, random_state=42)
[2 2 2 2 2 0 2 2 2 2 2 2 2 2 2 2 2 2 0 2 2 2 2 2 2 2 2 2 2 2 2 2 2 2 2 2 2
2 2 2 2 2 0 2 0 2 2 2 2 2 2 2 0 2 2 2 2 2 2 2 2 2 0 0 2 2 2 2 2 2 2 2 0 2
2 2 2 2 2 2 2 2 2 2 2 2 2 2 2 2 2 0 2 2 2 2 2 2 2 2 0 0 0 0 0 0 0 0 0 0 0
0 0 0 0 0 0 0 0 0 0 0 0 0 0 0 0 0 0 0 0 0 0 0 0 0 0 0 0 0 0 0 0 0 0 0 0 0
0 0 0 0 0 0 0 0 0 0 0 0 0 0 0 0 0 0 0 0 0 0 0 0 0 0 0 0 0 0 0 0 0 0 0 0 0
0 0 0 0 0 0 0 0 0 0 0 0 0 0 0 1 1 1 1 1 1 1 1 1 1 1 1 1 1 1 1 1 1 1 1 1 1
1 1 1 1 1 1 1 1 1 0 1 1 1 1 1 1 1 1 1 1 1 1 1 1 1 1 1 1 1 1 1 1 1 1 1 1 1
1 1 1 1 1 1 1 1 1 1 1 1 1 1 0 1 1 1 1 1 1 1 1 1 1 1 1 1 1 1 1 1 1 1 1 1 1
1 1 1 1]
1 2 print (np.unique(km.labels_, return_counts=True ))
(array([0, 1, 2], dtype=int32), array([111, 98, 91]))
Images of each label 1 2 3 4 5 6 7 8 9 10 11 12 13 14 import matplotlib.pyplot as pltdef draw_fruits (arr, ratio=1 ): n = len (arr) rows = int (np.ceil(n/10 )) cols = n if rows < 2 else 10 fig, axs = plt.subplots(rows, cols, figsize=(cols*ratio, rows*ratio), squeeze=False ) for i in range (rows): for j in range (cols): if i*10 + j < n: axs[i, j].imshow(arr[i*10 + j], cmap='gray_r' ) axs[i, j].axis('off' ) plt.show()
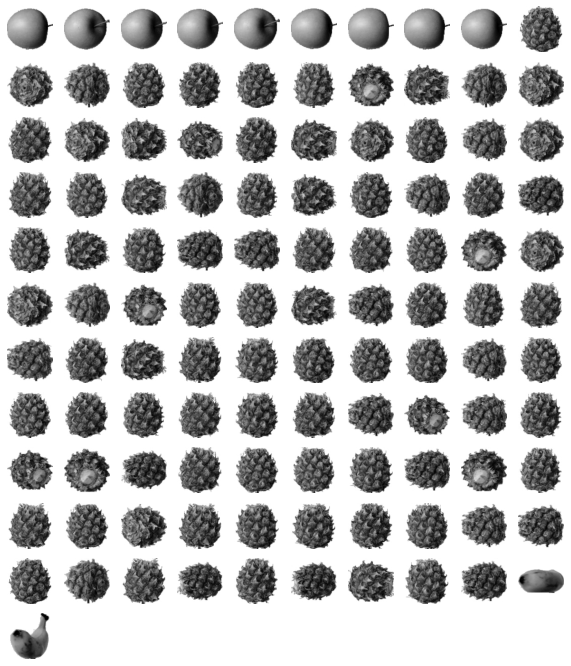
1 draw_fruits(fruits[km.labels_==0 ])
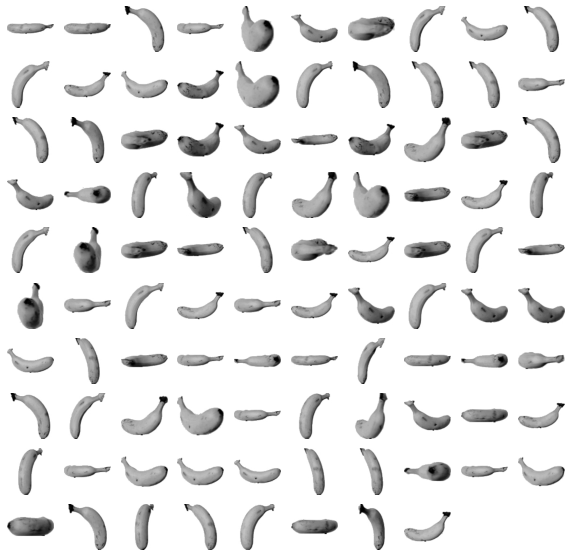
1 draw_fruits(fruits[km.labels_==1 ])
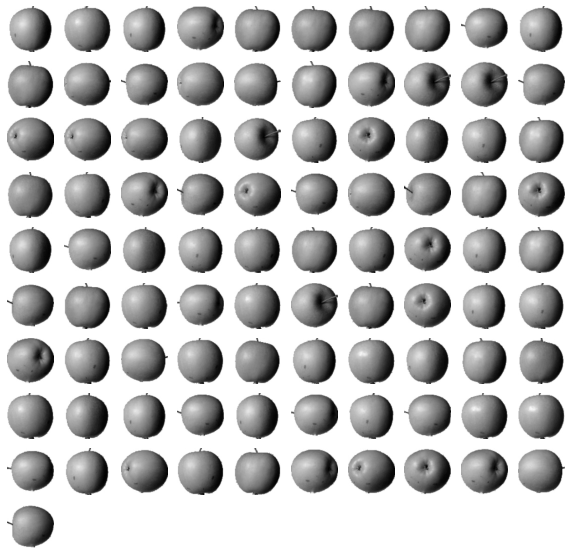
1 draw_fruits(fruits[km.labels_==2 ])
label 0: mostly pineapples
label 1: mostly bananas
label 2: mostly apples
Centroid 1 print (km.cluster_centers_.shape)
(6, 10000)
(6, 100, 100)
1 draw_fruits(km.cluster_centers_.reshape(-1 , 100 , 100 ), ratio=3 )
1 print (km.transform(fruits_2d[100 :101 ]))
[[3393.8136117 8837.37750892 5267.70439881]]
1 print (km.predict(fruits_2d[100 :101 ]))
[0]
1 draw_fruits(fruits[100 :101 ])
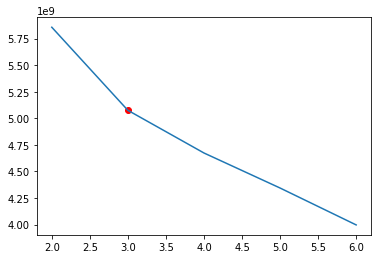
Finding the best K (Elbow method)
inertia : sum of squares of the distance between centroid and each sample
As K increases, inertia decreases.
Set the optimal K at the point where the inertia graph is bent.
1 2 3 4 5 6 7 8 9 10 11 12 13 14 15 16 17 18 19 20 inertia = [] for k in range (2 ,7 ): km = KMeans(n_clusters=k, random_state=42 ) km.fit(fruits_2d) inertia.append(km.inertia_) slope = [] lst = [] for idx, val in enumerate (inertia): if idx==0 : slope.append(0 ) lst.append(0 ) else : slope.append(val - inertia[idx-1 ]) lst.append(slope[idx-1 ]-slope[idx]) fig, ax = plt.subplots() ax.plot(range (2 ,7 ), inertia) ax.scatter(2 +np.argmax(lst), inertia[np.argmax(lst)], marker="o" , color="red" ) plt.show()
Ref.) 혼자 공부하는 머신러닝+딥러닝 (박해선, 한빛미디어)